



A TikTok engagement rate calculator returns a single percentage: total interactions divided by either views or followers, multiplied by 100. Use the view-based formula when you're diagnosing how a specific video performed with the people who saw it. Use the follower-based formula when you're screening or ranking creators against each other at scale. The Mastros TikTok extension exports creator profiles and profile videos with exact engagement rates, so you can check either formula against real counts.
TL;DR:
- The view-based engagement rate typically exceeds the follower-based rate, especially for viral videos, and averages around 4.20% according to 2026 benchmarks.
- Accurate calculation requires clean data from TikTok analytics, including views, likes, comments, shares, and saves, with only creator-level analytics providing saves.
- Use a sample of 10 to 30 recent posts or the last 30 days' content to generate a reliable engagement rate, clearly stating the methodology and sample size.
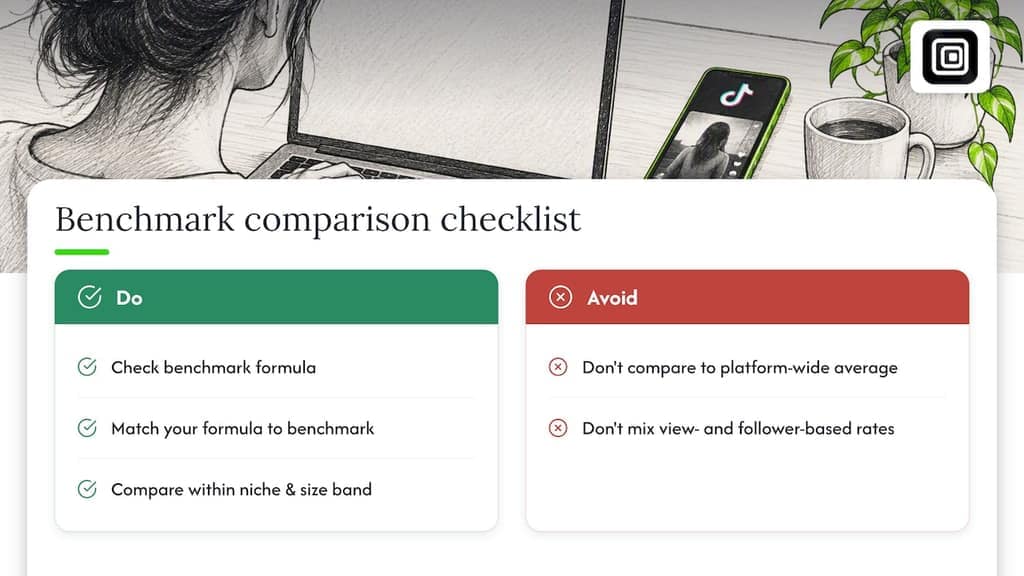
- Match your engagement formula with the benchmark's method before comparing, as platform-wide averages differ depending on whether views or followers are used as the denominator.
- Engagement rate should be one part of a broader content assessment, combined with metrics like watch time and follower conversion, for better decision-making.
Table of Contents
- Exact formulas and worked examples for TikTok engagement rate
- Step by step: gathering the inputs and running the numbers
- Choosing the denominator: views vs followers
- Sampling and reporting: what every engagement-rate report needs
- Benchmarks and why they rarely compare cleanly
- How Mastros' exports support precise engagement-rate inputs
- Engagement rate is one diagnostic, not the whole picture
- Mastros: export the exact counts your engagement-rate audit needs
- Sources
- FAQ
Exact formulas and worked examples for TikTok engagement rate
Two formulas cover almost every use case, and the difference between them matters more than most people realize.
- View-based: (likes + comments + shares + saves) ÷ views × 100
- Follower-based: (likes + comments + shares + saves) ÷ followers × 100
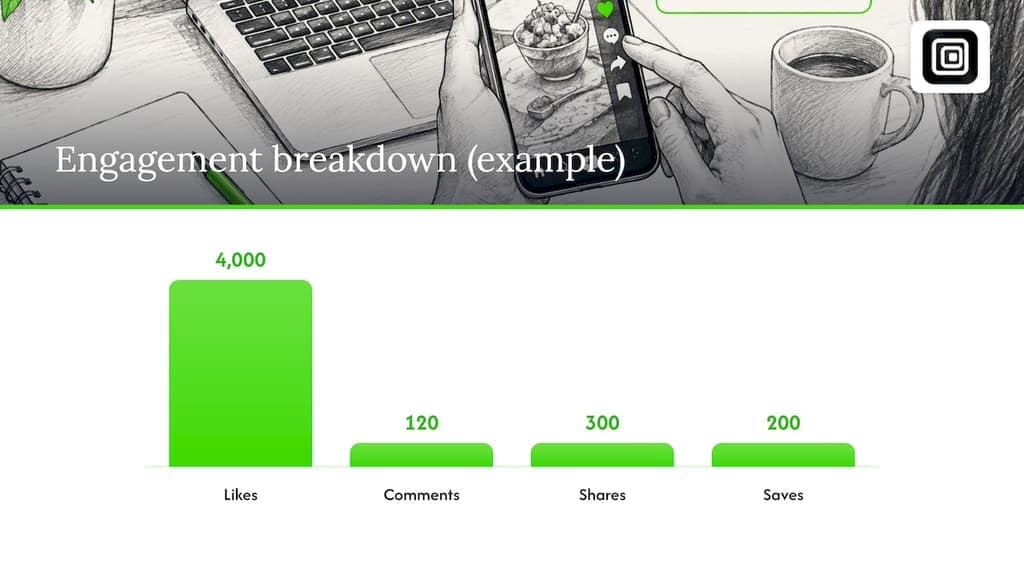
Take a video with 4,000 likes, 120 comments, 300 shares, and 200 saves, viewed 50,000 times. Add the interactions: 4,620. Divide by views: 4,620 ÷ 50,000 = 0.0924. Multiply by 100 and you get 9.24%, matching the worked example method that benchmark researchers use, rounded to two decimal places.
Engagement rate by views can run well above follower-based rates on accounts with strong distribution, since TikTok's 2026 benchmark data puts the typical view-based rate near 4.20%, far below the 9.24% in the example above, which shows how much a single viral post can skew an average.
For the numerator, stick to likes, comments, shares, and saves. Profile views and follows triggered by a video are useful signals but belong in a separate conversion metric, not folded into engagement itself. For a deeper breakdown of each term, our guide to the exact formula walks through edge cases like duets and stitches.
Step by step: gathering the inputs and running the numbers
Before you touch a calculator, you need clean inputs. Here's the sequence that keeps the process honest.
- Open TikTok analytics (for your own account) or the public video page (for someone else's) and record views, likes, comments, and shares for each post.
- Check for saves, which only appear in creator-level analytics; Buffer's guide to TikTok analytics confirms this field is often unavailable on public profiles.
- Pick your sample: either the most recent N posts or everything published in a fixed window, like the last 30 days.
- Log each post with its date, views, likes, comments, shares, and saves in a spreadsheet row.
- Apply the formula in a spreadsheet column, then compare that output against whatever calculator you're using to confirm they match.
A spreadsheet formula like =(B2+C2+D2+E2)/F2*100 (interactions over views) reproduces most calculators exactly, which makes it easy to spot a tool that's quietly using a different denominator.
Pro Tip: Run the same five posts through two different calculators before trusting either one; a mismatch almost always means one tool is including saves and the other isn't.
Choosing the denominator: views vs followers
The denominator you choose answers a different question, not just a different number.
- View-based rate tells you how the people who actually watched a video responded, which is the right lens for judging content quality post by post.
- Follower-based rate gives you a standardized figure for comparing creators side by side, since it ignores how far any single video traveled.
- Viral or algorithmically boosted content skews view-based rates downward even when absolute engagement is high, because the denominator balloons faster than interactions do.
- Small accounts with limited reach often look stronger on a follower basis than a view basis, simply because their followers make up a larger share of total viewers.
Hootsuite's guidance on TikTok engagement formulas frames this as a decision about the question you're asking, not a math dispute: pick view-based for content diagnosis, follower-based for screening and shortlisting, and never swap one for the other mid-comparison.
Sampling and reporting: what every engagement-rate report needs
A single post's engagement rate tells you almost nothing about an account. Reporting on a sample, with the method stated, is what makes a number trustworthy.
- Use a recent sample of 10 to 30 posts, or everything published in the last 30 days; smaller samples swing wildly post to post, while larger ones smooth out one-off spikes.
- Label the formula explicitly: state whether the rate is view-based or follower-based, which interactions are counted, and whether saves and profile views were included.
- State the sample size and date range in the same sentence as the rate itself, since a 9% engagement rate from three posts means something very different from 9% across thirty.
- Account for posting frequency and account size when interpreting volatility: accounts that post daily tend to show steadier averages than ones that post twice a month, where a single viral clip can swing the whole sample.
Influencer Marketing Factory's method notes recommend 20 to 30 recent videos as a workable baseline sample, though the exact count matters less than stating it consistently every time you report.
Benchmarks and why they rarely compare cleanly
Published benchmarks are only useful once you know exactly how they were calculated.
TikTok's view-based engagement rate averaged around 4.20% in Socialinsider's 2026 benchmark report, a figure that depends heavily on the sample window and account mix used to produce it. A follower-based average calculated from the same dataset would land at a different number entirely, not because engagement changed but because the denominator did.
This is why comparing your own rate against a platform-wide average is often misleading. Match your formula to the benchmark's formula first, then compare within your own niche and account-size band rather than against the platform as a whole. A beauty creator with 5,000 followers and a news account with 2 million are playing different games, even when their raw percentages look similar.
How Mastros' exports support precise engagement-rate inputs
Collecting view, like, comment, and share counts by hand across dozens of posts invites copy errors, especially when you're cross-referencing a spreadsheet against a live feed.
- Browser-only exports read what your own signed-in session already shows, with nothing uploaded to a Mastros server and no API keys required.
- Per-post counts export directly to CSV or JSON, which plugs straight into the spreadsheet formulas used to reproduce calculator output.
- Bulk exports across many posts cut down the manual re-typing that introduces mismatched numbers between your log and the live platform.
TikTok exports, including engagement-rate calculations from TikTok's real counts, are launching soon through the TikTok Scraper and Engagement Rate Export product line, alongside creator, video, and comment exports.
Engagement rate is one diagnostic, not the whole picture
Engagement rate measures interaction, not retention, and treating it as the full verdict on a video or a creator misses half the story. Pair it with average watch time, completion rate, and follower conversion before making a partnership or content call. Report all four together, and always label your formula so nobody downstream mixes a view-based number with a follower-based one by accident.
— Elias Mahdavi
Mastros: export the exact counts your engagement-rate audit needs
Running a reproducible engagement-rate audit across dozens of creators by hand is slow, and copy-paste errors creep in fast. Some browser extensions read the visible counts your own browser session already displays and export them straight to CSV or JSON, so the inputs behind your calculation are logged accurately the first time. There's no API key, no second login, and nothing leaves your browser. Browse the TikTok Scraper and Engagement Rate Export page for what's launching, or start with the Free plan to see how Mastros handles exports across other platforms today. For workflow ideas on turning these exports into a repeatable reporting cadence, Epicware's growth tools cover reporting structures that pair well with this kind of data.
Sources
- 2026 TikTok Benchmarks
- Free TikTok engagement rate calculator
- TikTok Analytics: A Guide for Creators and Small Businesses
FAQ
What is a good TikTok engagement rate?
There's no single answer, since the right benchmark depends on the formula and sample used. Socialinsider's 2026 benchmark puts the typical view-based rate near 4.20%, but compare that figure only against other view-based reports using a similar sample window.
Should I use views or followers to calculate engagement rate?
Use views when you want to know how the people who actually watched a video responded, and use followers when you're standardizing comparisons across multiple creators. Hootsuite's guidance frames this as a choice tied to the decision you're making, not a fixed rule.
How many posts should I sample to calculate engagement rate?
A sample of 10 to 30 recent posts, or everything published in the last 30 days, gives a steadier average than judging an account from a single video. Influencer Marketing Factory recommends 20 to 30 recent videos as a practical baseline.
Do saves count in the TikTok engagement rate formula?
Saves are commonly included alongside likes, comments, and shares in the numerator, but they only show up in creator-level analytics, not on public profiles. Buffer's analytics guide confirms that some fields require account-level access rather than public viewing.
Can engagement rate alone tell me if a creator is worth partnering with?
Engagement rate shows interaction, but it doesn't capture retention, so pairing it with average watch time, completion rate, and follower conversion gives a fuller picture. Treat a strong engagement rate as one signal among several rather than the deciding factor.