



An engagement rate calculator turns raw likes, comments, and follower counts into one comparable number: usually (likes + comments) ÷ followers × 100. That baseline formula is a solid starting point, but it's not the finish line. Instagram, TikTok, YouTube, and LinkedIn each expect different inputs, so you'll need to adjust the denominator once you know your goal. Tools like Mastros's engagement-rate calculator can pull the visible metrics you need straight from the platform, which saves you the tedium of copying numbers by hand.
TL;DR:
- Engagement rate formulas vary widely across platforms, with TikTok rates typically two to three times higher than Instagram due to differing metrics like shares influencing the calculation.
- Using followers as the denominator is suitable for account-level benchmarking, while reach, impressions, or views are more accurate for post-specific or video performance analysis.
- Calculating median engagement across nine to twelve non-promotional posts provides a more reliable metric than relying on a single viral or failed post.
- Automated tools like Mastros can streamline data collection and export, reducing manual errors and helping to produce reproducible, defendable engagement numbers.
- Always specify whether your engagement rate is followers-based, impressions-based, or views-based to prevent misinterpretation and ensure accurate benchmarking.
Table of Contents
- How to Calculate Engagement Rate Step by Step
- Which Numerator and Denominator Should You Use?
- Platform Formulas and What Counts as a Good Rate
- Getting Numbers You Can Actually Trust
- Where Mastros Fits Into a Reproducible Workflow
- Choosing the Right Rate for the Right Audience
- What Mastros Offers for Engagement Reporting
- Where These Numbers Come From
- Sources
- FAQ
How to Calculate Engagement Rate Step by Step
Before you touch a calculator, gather the raw numbers. You'll need: follower count, likes, comments, shares, saves, and (where visible) impressions, reach, or views, plus a decision on how many posts you're analyzing.
- Pick your sample. One post gives you a snapshot; nine to twelve recent, non-promotional posts give you a trend.
- Total the engagement actions. Add likes, comments, and any other numerator you're including (shares, saves) across your sample.
- Choose your denominator. Followers for account-level benchmarking, reach or impressions for post-level performance, views for video.
- Divide and multiply by 100. That's your rate, expressed as a percentage.
- Average or find the median if you're working across multiple posts, rather than reporting just one.
A free calculator automates the summing and dividing across dozens of posts at once, which matters once you're tracking a creator roster or a client account month over month.
Which Numerator and Denominator Should You Use?
The numerator question comes down to what counts as "engagement" for your goal. Likes and comments are the baseline, but saves, shares, and bookmarks often say more about whether the content actually resonated. Saves and shares correlate more strongly with downstream conversions than likes do, which is worth remembering if your report needs to justify a budget, not just a vanity number.
The denominator question is where most confusion starts:
- Followers works for account-level benchmarking. Use it when comparing creators or tracking your own growth over time.
- Reach or impressions fits post-level or campaign performance, since it reflects who actually saw the content, not just who follows you.
- Views is the right call for video content, where a video can circulate well beyond your follower base.
Pro Tip: Always label which denominator you used when sharing a number with a client or stakeholder. A "4.6% engagement rate" means something different depending on whether it's follower based or impression based, and an unlabeled number invites disputes later.
Different calculators default to different formulas. Some skip saves entirely; others fold shares into the numerator only on certain platforms. Before you compare two tools' output, check what each one actually measures.
Platform Formulas and What Counts as a Good Rate
Each major platform rewards a slightly different formula, and treating them as interchangeable is where most benchmarking goes wrong.
Instagram uses (likes + comments + saves, when visible) ÷ followers × 100.
TikTok typically runs (likes + comments + shares) ÷ followers × 100, though views-based metrics work better for campaign analysis since TikTok's algorithm pushes content well past your follower base. Rates on TikTok tend to run two to three times higher than Instagram's, partly because shares carry more weight in the platform's own calculation.
YouTube should use views, not subscribers, as the denominator: (likes + comments) ÷ views × 100. Separate Shorts from long-form uploads in your reporting, since the two formats behave nothing alike.
LinkedIn runs on impressions: (reactions + comments + reposts) ÷ impressions × 100, reflecting the platform's feed-based distribution rather than a strict follower relationship.
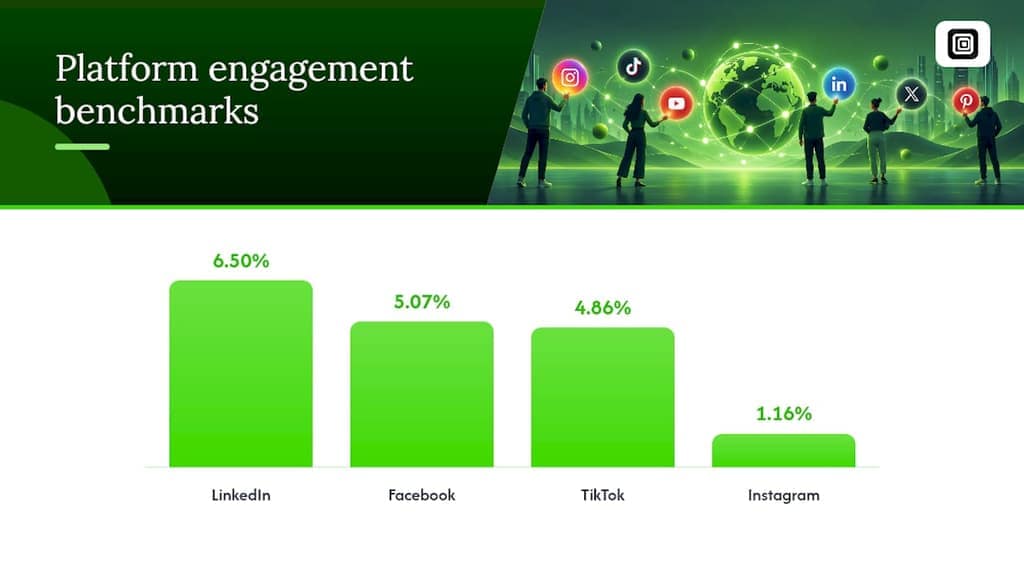
Cross-platform data backs up how differently these numbers land. Buffer's benchmarking puts average engagement rates at roughly 6.50% for LinkedIn, 5.07% for Facebook, 4.86% for TikTok, and 1.16% for Instagram.
| Platform | Recommended denominator | Typical range |
|---|---|---|
| Followers | Around 1% to 3%+ for smaller accounts | |
| TikTok | Followers or views | Roughly 4.86% average |
| YouTube | Views | Varies by format; Shorts and long-form differ |
| Impressions | Around 6.50% average | |
| Followers or reach | Around 5.07% average |
Benchmarks shift fast. Reels have outperformed TikTok's average reach engagement in some recent measurement periods, according to Emplifi's 2025 benchmarks report, so treat any fixed number as a snapshot, not a permanent rule.
Getting Numbers You Can Actually Trust
A single post's rate tells you almost nothing reliable on its own. One viral hit or one flop skews the picture, so pull the median across your last nine to twelve non-promotional posts instead of leaning on one data point.
A few habits separate a defensible number from a guess:
- Exclude sponsored or boosted posts, since paid reach distorts organic performance.
- Use median over average when you have outliers. One post with unusual reach can drag an average way off from what's typical.
- Record the exact posts (IDs and dates) used in your sample, so anyone can check your work later.
- Never mix denominators across platforms in the same comparison. Followers-based Instagram numbers and impressions-based LinkedIn numbers aren't the same currency.
The most common mistake isn't math error, it's trusting a tool without checking its formula first. Two calculators can both say "engagement rate" and mean entirely different things depending on whether they count saves or use reach instead of followers.
Where Mastros Fits Into a Reproducible Workflow
Calculating a defensible rate depends on clean inputs, and that's usually the slow part. Mastros runs entirely in your browser and exports the visible metrics, likes, comments, followers, and views where shown, directly into CSV or JSON files without uploading anything to a server or requiring API credentials.
That matters for a few practical reasons:
- Exporting removes manual copy-paste errors when you're pulling numbers across a dozen posts.
- A structured file makes it easy to compute a median rate across the exact sample you selected, then keep that file as your record if a client asks how you got the number.
- Because nothing is automated or uploaded, you're working with the same data you'd see scrolling the platform yourself, just organized into a spreadsheet instead of a feed.
Choosing the Right Rate for the Right Audience
Report followers-based rates when comparing creators publicly. Use impressions or reach for campaign performance reviews, and views for video ROI conversations. Pair engagement rate with conversion or click-through rate whenever a decision hinges on money, not just attention, and note seasonality before comparing periods that aren't alike.
What Mastros Offers for Engagement Reporting
Mastros gives you a privacy-first way to get from raw platform data to a reproducible engagement number without uploading anything to a third-party server or juggling API keys. The engagement-rate calculator reads what your own signed-in session already shows and exports it to CSV or JSON, so the median-across-nine-posts workflow described above takes minutes instead of an afternoon of copy-paste. If your reporting leans video-first, the TikTok Scraper and Engagement Rate Export computes rates from TikTok's actual counts rather than estimates. Plans start with a free tier and include paid options for higher export volumes; current prices are available on the Mastros pricing page. Try the free plan on your next reporting cycle and see how much faster a clean export gets you to a number you can defend.

Where These Numbers Come From
Formulas and benchmark ranges in this piece draw on Hootsuite's calculation guidance, Buffer's cross-platform averages, and Socialinsider's platform-specific formula breakdowns. For deeper analytics context, this piece on hidden SEO metrics is worth a look too.
Sources
- How to calculate engagement rate (Hootsuite)
- Average engagement rate across platforms (Buffer)
- Engagement rate calculator (Hootsuite)
- How to calculate engagement rate for all social platforms (Socialinsider)
FAQ
How Do You Calculate Engagement Rate?
Add up likes and comments (plus shares or saves if you're including them), divide by your chosen denominator (usually followers), then multiply by 100. The exact formula shifts by platform: TikTok often adds shares, YouTube uses views, and LinkedIn uses impressions instead of followers.
Is a 4.2% Engagement Rate Good on Instagram?
Yes, an Instagram engagement rate well above the platform average, which Buffer places around 1.16%, is especially strong for a larger account; smaller creators can hit similar or higher numbers more easily since their audience tends to be more engaged per post.
What's My Instagram Engagement Rate?
Add your likes and comments (include saves if your source shows them) across your last nine to twelve non-promotional posts, divide by your follower count, then multiply by 100 to get a percentage. Tools like the Instagram Follower Export & Scraper can pull those public metrics into a spreadsheet so you're not counting by hand.
What Does a 1% Engagement Rate Mean?
It's not automatically bad. Context like account size, niche, and whether the post was promotional all shift what "normal" looks like for that specific account.
Do Different Calculators Give Different Results for the Same Post?
Yes, because tools vary in which metrics they count. Some include saves and shares in the numerator while others stick to likes and comments only, and some default to followers as the denominator when reach or impressions would be more accurate for that platform.